
Whether you’re familiar with Google Analytics SEO reports or not, it’s a comprehensive platform with many metrics beyond keyword rankings. While keywords are necessary to monitor, connecting these rankings to your actual traffic analytics (not averages or aggregates) is how to measure your site’s SEO performance data more accurately.
That way, you have data-driven decisions to optimize your website effectively for a greater content marketing ROI.
Learn more about using Google Analytics for SEO, which reports are essential to track, and how to analyze them for improving SEO strategies.
5 Essential Google Analytics SEO Reports Your Business Should Leverage to Track, Analyze & Optimize Performance
Navigating Google Analytics SEO reports can be complex, with many features, dashboards, and metrics available. Below are the five essential Google Analytics 4 (GA4) reports you should leverage for optimal search performance.
1. Traffic Acquisition: Session Primary Channel Group (Default Channel Group)
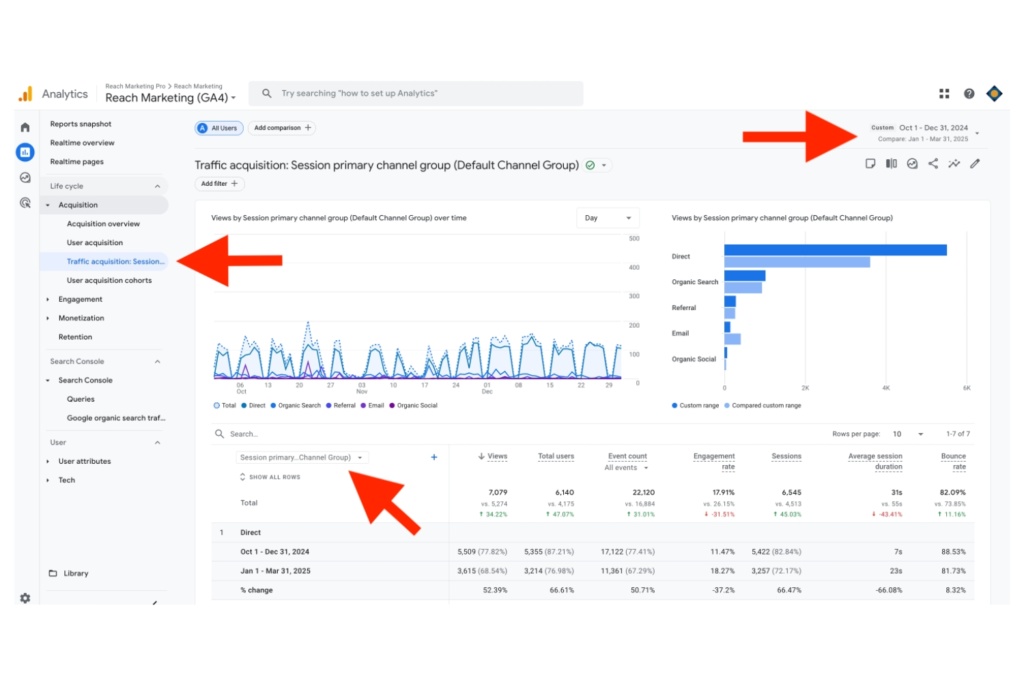
The Traffic Acquisition Google SEO report measures how many people visit your website and how they interact with it. This report is necessary to evaluate as it determines how successful your site is in attracting users and keeping them on it based on their behaviors.
When entering the dashboard, configure it to Session Primary Channel Group (Default Channel Group) to review which sources contributed the most traffic your site acquired, such as Performance Max ads or organic social media. That way, you know which campaigns were the most successful for generating the most website traffic and the least for better budget optimization.
We recommend reporting on this quarterly and comparing it to the previous quarter to measure its progress, as it’ll show the quarterly increase and decrease percentages.
You can also configure the traffic acquisition metrics you want displayed in this dashboard.
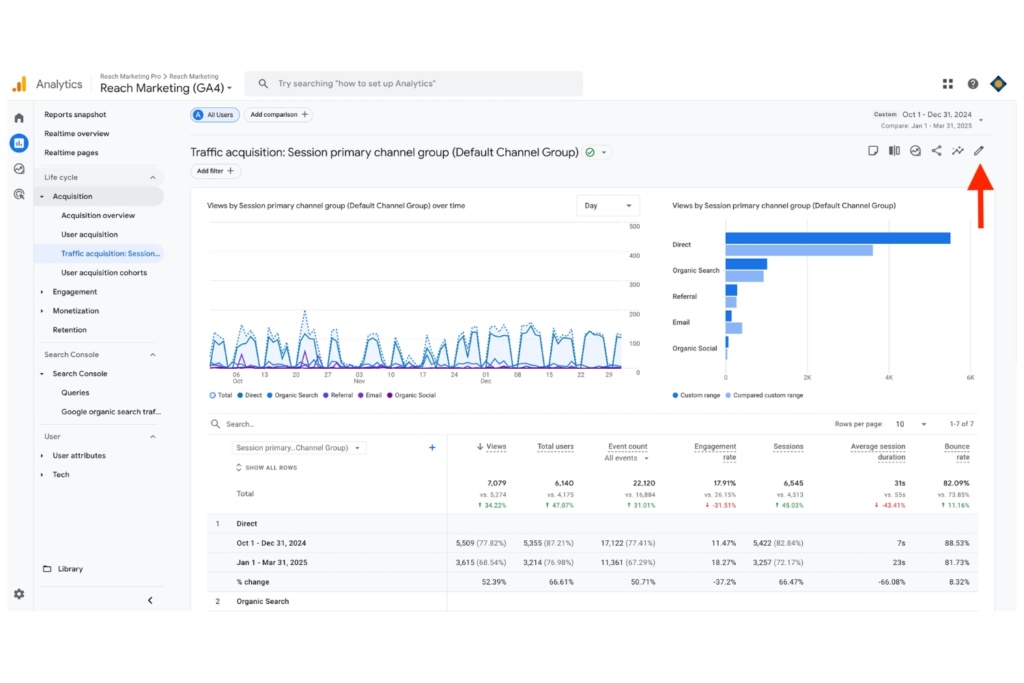
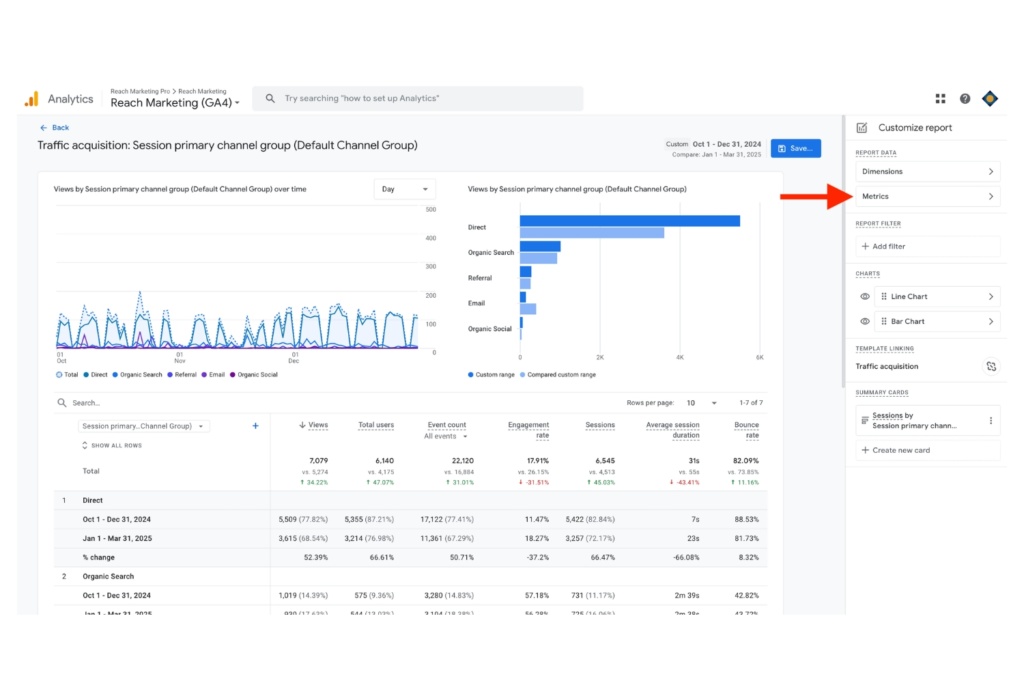
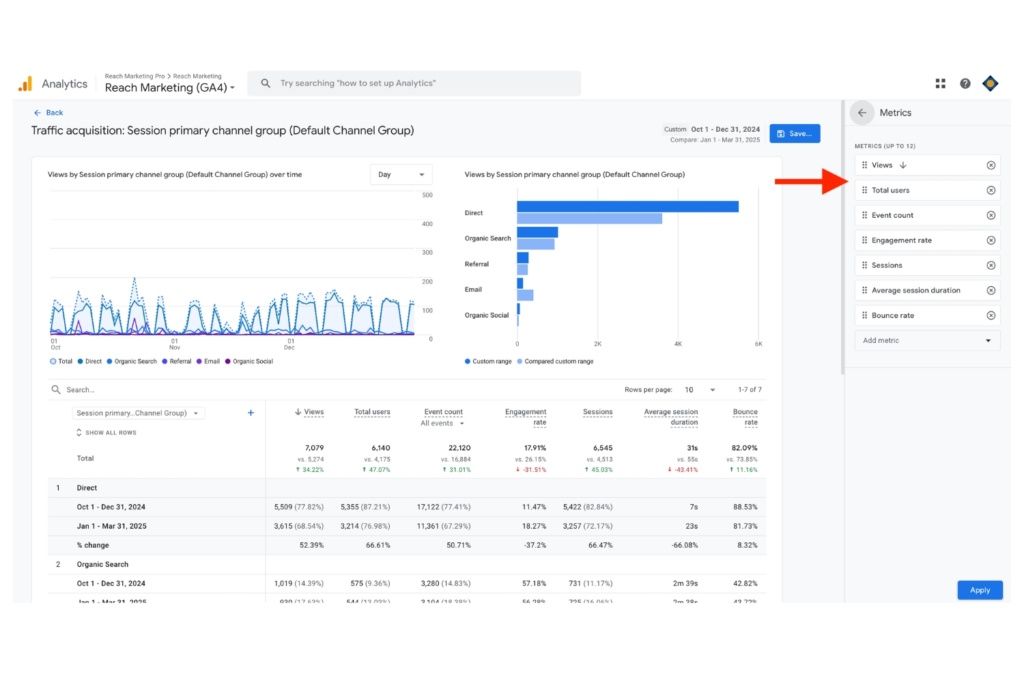
We suggest configuring the Traffic Acquisition dashboard to the following metrics:
- Views: Total number of website views
- Total Users: Total number of new and returning people who visited your site
- Event Count: How many people entered your site, and the channel they entered from
- Sessions: Total number of people who interacted with your site within 30 minutes, adding items to cart, page browsing, etc.
- Engagement Rate: How often people have active interactions longer than 10 seconds, such as two or more page views and at least one conversion event, with your site
- Average Session Duration: Average time people spent and/or interacted on each website page
- Bounce Rate: How often people leave your site
2. Engagement: Pages and Screens
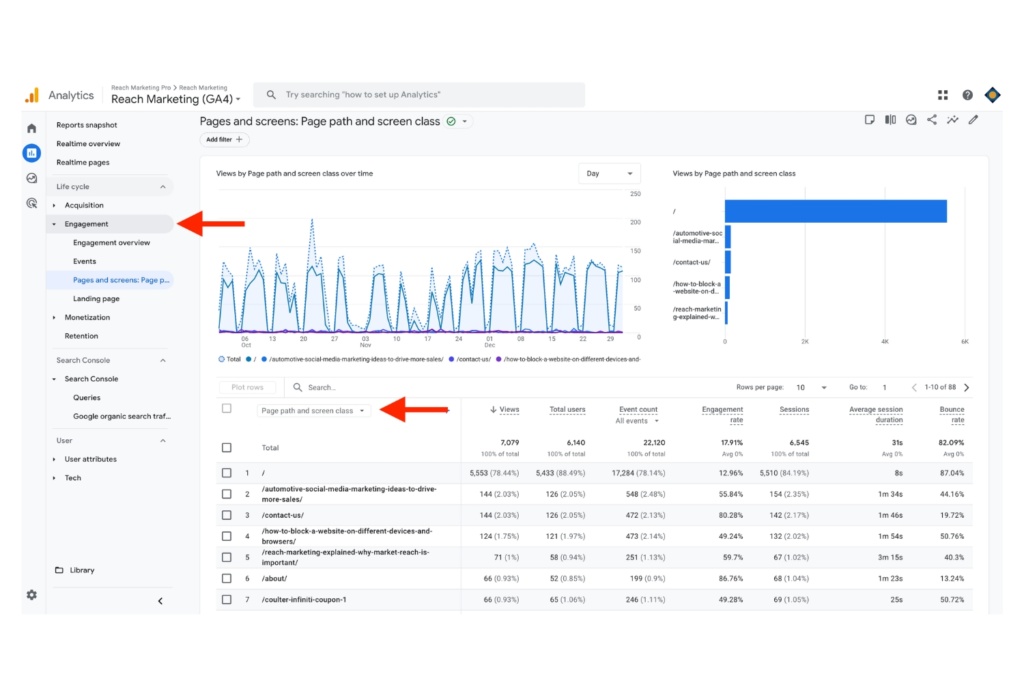
The Engagement Acquisition Google SEO report measures how visitors interact with your website. This report is necessary to track as it determines how successful your site is in getting users to engage with it based on their behaviors. We also recommend reporting on this quarterly with the same metrics as your Traffic Acquisition report in the same right-hand menu.
When entering the dashboard, configure it to Page Path and Screen Class so you can see where users are entering and interacting with the most. It’ll show which pages are the top and lowest-performing, so you can discover optimization opportunities.
For example, if you find a bounce rate of 60% or higher, it may be a sign that your website design is pushing people away from a lack of engagement value. Common reasons for this are poor user experience, such as slow page load speed or lack of mobile-friendly design.
3. Engagement: Landing Page
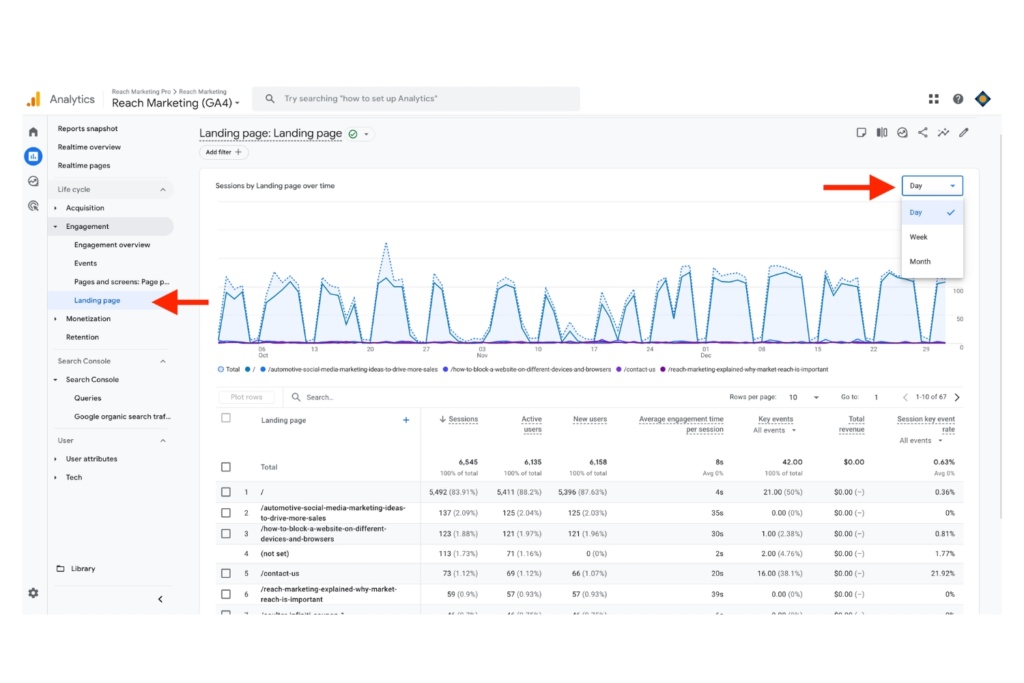
Previously known as Conversions, the Engagement Landing Page report measures the performance of your landing pages. This dashboard is especially useful for e-commerce brands that depend on strong product page SEO for conversions and businesses running Google ad campaigns.
Like other GA4 SEO reports, you can configure it to track specific landing data you want. We recommend customizing it with the same Traffic and Engagement report metrics, plus conversions and total revenue.
You can even configure the dashboard with a daily, weekly, or monthly breakdown of the data provided. This feature is convenient when launching campaigns in specific periods. That way, you can review if your SEO strategies are generating profitable revenue and a greater ROI.
4. Google Search Console: Queries and Pages
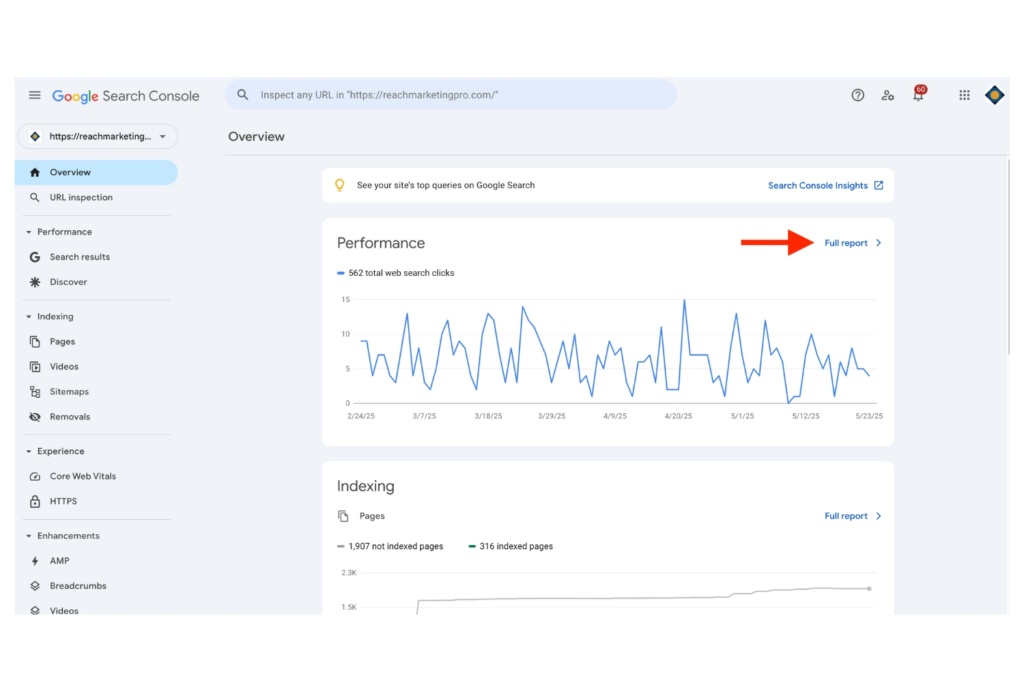
In addition to GA4 SEO reporting, Google Search Console (GSC) is essential to measure your site’s search performance. While it’s not part of the GA4 platform, GSC is a key Google SEO report focusing on your website’s visibility rather than the user behavior of your site’s visitors.
Having data on your site’s content ensures it’s performing as it should on Google’s search engine.
Google Search Console: Queries
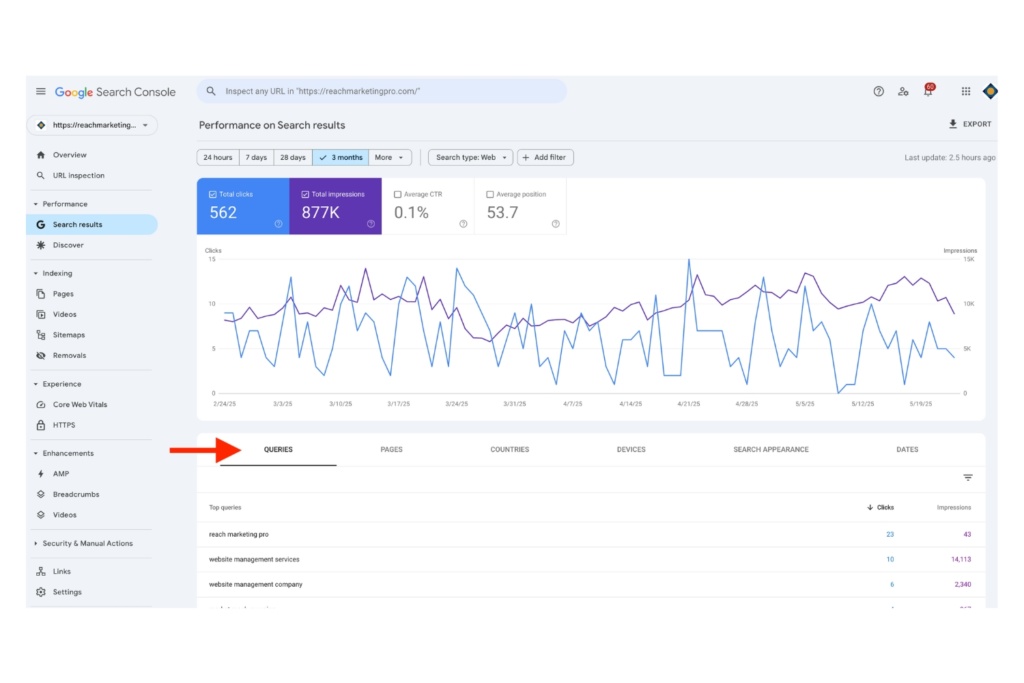
When logging into GSC, click Full Report and evaluate the Queries section by scrolling down. The Queries report displays the top search queries people used to visit your site during a set period.
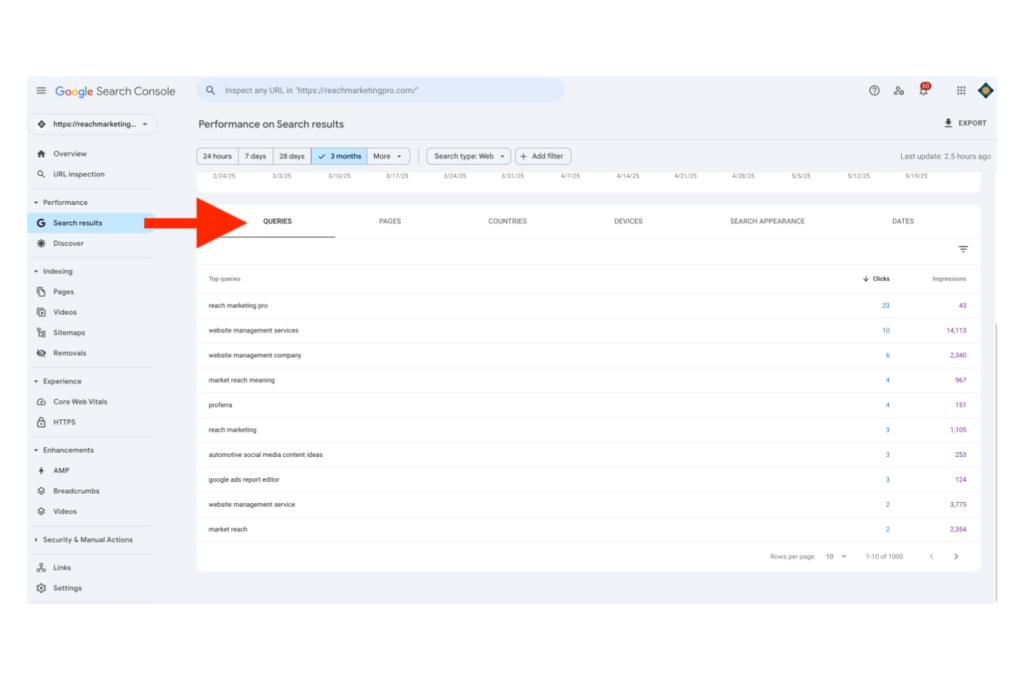
You can use this information to identify popular keywords people use to drive more organic traffic and optimize your site’s content with them for higher rankings. We recommend reporting this on at least a quarterly basis.
Google Search Console: Pages
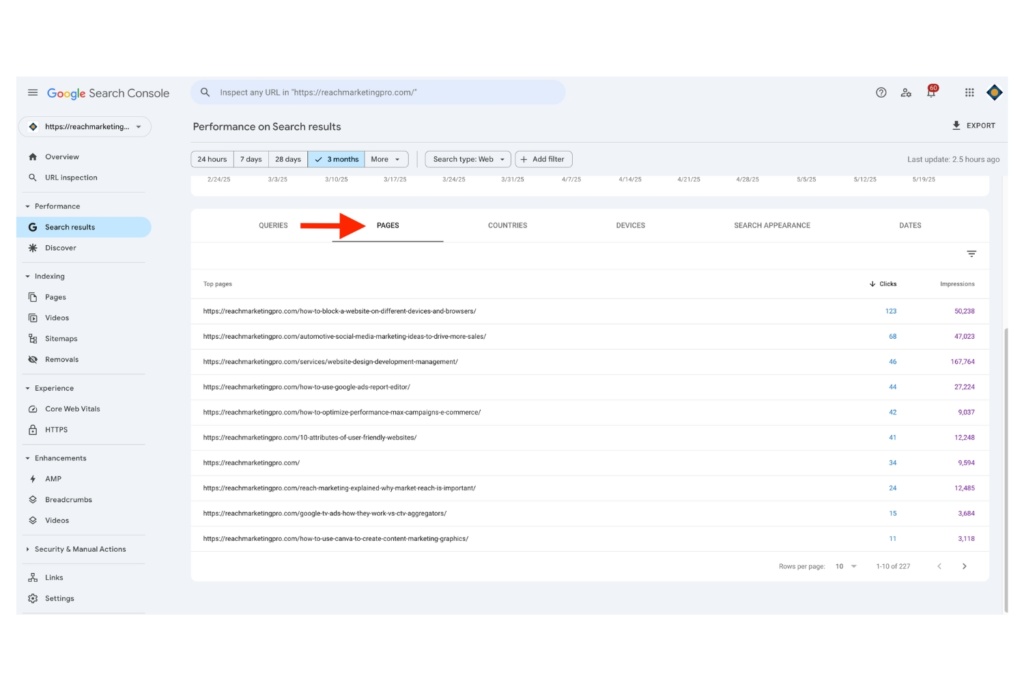
Next to the Queries tab, you’ll find the Pages tab. Click that to find your website’s pages’ performance during a set period. These page rankings factor in the most clicks and impressions (the number of times that page URL was shown in the search results). We also recommend reporting on this at least quarterly for an optimal SEO content strategy.
These insights are crucial to understanding how well your pages’ content performs, as they show what resonates with your target audience the most. You can discover content or page structure trends driving the best organic search performance and use that to improve lower-performing ones.
For example, if a blog post about “best project management tools” is one of your site’s top-performing pages, you can use this data to create more content on this topic because you know it’s popular with your audience.
You can also structure future-related blog posts with similar visuals, like dashboard screenshots or GIFs, to enhance SEO performance further within Google’s E-E-A-T guidelines.
5. Google Search Console: Search Results Performance

When logging into GSC and clicking Full Report, you’ll find a Search Results Performance report above the Queries and Pages section. The difference with this report is that it’s a broader overview of your website’s SEO performance in the Google search engine results page (SERP) versus specific queries and pages.
The Search Results Performance report provides the following metrics during a set period:
- Total clicks
- Total impressions
- Average Click-Through Rate (CTR): The average rate at which people click through to enter your site.
- Average Position: The average keyword ranking position for your entire website.
Analyzing these metrics helps you understand how your site’s traffic changes over time, where it’s coming from, and which queries are most likely to display your site in Google’s SERP.
If your website’s Average Position is starting to decline, you may be targeting the wrong keywords or using them incorrectly in your content based on the user’s search intent. For example, using transactional keywords like “running shoes” in blog posts may be the wrong search intent because people use this query to find product pages and are ready to buy, not learn more.
Get the Most Out of Your Google SEO Reports & Start Optimizing Smarter
SEO is a multi-faceted marketing practice because it involves many metrics to monitor for optimal success. At Reach Marketing Pro, we can help you streamline this process for better results.
We’re a full-service digital marketing agency providing services in all aspects of SEO, including SEO content writers, website design/development optimization, PPC, and more. Whether you have an existing website or need a new one, we have extensive SEO experience to ensure your SEO strategies support your bottom line.
Ready to maximize your site’s search performance?
Learn more about our SEO services, or contact us to get started today!