
GA4 Exploration reports go beyond your standard SEO reporting. It dives deeper into your website’s SEO data by gaining more insights into its user behavior. From customizable data views to several dashboard filters and audience segments, it provides advanced SEO analysis that isn’t available in traditional Google Analytics 4 SEO reports.
This comprehensive guide will walk you through GA4 Explorations and how to navigate each report to show you the SEO data that matters most for your business.
GA4 Exploration Reports: A Complete SEO Guide to Navigating Dashboards & Templates
GA4 Explorations is a powerful reporting tool to help you monitor your website’s key metrics, including SEO. Below, we’ll break down the advantages of using this platform for your business and how to use all seven reports to improve your SEO efforts.
Understanding the Benefits of GA4 Exploration Reports for Your Site’s SEO
Here’s how GA4 Explorations can strengthen your site’s SEO performance:
Customizable SEO Data Features for In-Depth Reporting
GA4 Explorations has many pre-built filters, variables, and segments to configure their dashboards. You can either create an exploration from a blank canvas or build one from an existing report. This feature allows you to configure the SEO data that you want to see more in-depth.
These customizable features include:
- Canvas: A large area that displays your site’s SEO data with seven pre-selected techniques (explained later below). It can also have multiple tabs, so you can use multiple techniques within a single exploration.
- Variables: A panel that gives access to the dimensions, metrics, and segments you can use. It can also change the timeframe of the exploration.
- Tab Settings: A feature that lets you configure the currently selected tab based on the technique, Variables panel, and customizable technique-specific options.
These capabilities help you understand your site’s SEO data further and answer complex questions about it.
Relevant User Behavior Metrics for Data-Driven SEO Strategies
GA4 Explorations bring more relevant user behavior insights on your website, so you can make more informed data-driven SEO strategy decisions, like content or design optimization. With highly customizable reporting features, like filters, variables, and segments, you can focus on the most relevant data on your website’s users and their journeys.
Centralized Dashboard Access for SEO Teams
After you create a GA4 Exploration, it can be the new standard template for your SEO teams to reference. Having centralized access ensures consistent SEO accuracy so they’re not customizing reports differently. Even if you have a large staff, you can create up to 200 individual explorations per user per property or up to 500 shared explorations per property.
Navigating All 7 GA4 Exploration Reports & How to Use Them for SEO
Now that you know the benefits of GA4 Exploration reports, here’s how to navigate each dashboard and understand the SEO metrics they provide.
1. GA4 Path Exploration
The GA4 Path Exploration report shows exactly how users interacted with your website via a tree graph. These include where they entered, exited, returned, the channel used, and the browser. This dashboard is useful for understanding the typical paths people take when visiting your site.
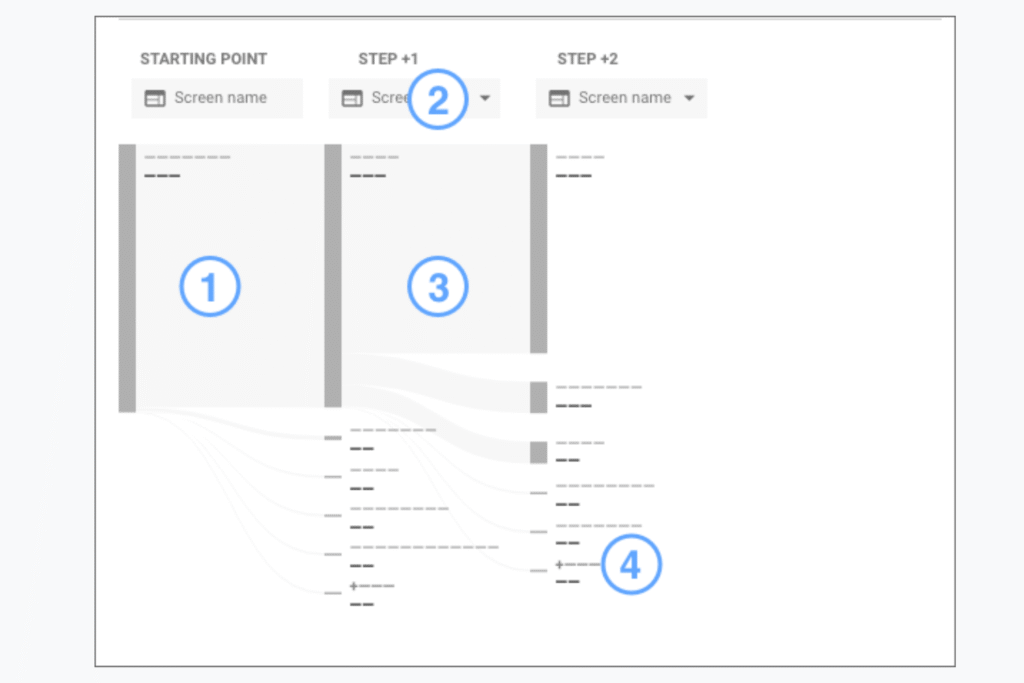
This report benefits your SEO efforts by discovering the top-performing pages that users go to, so you can reference these actionable trends and implement their attributes to lower-performing ones. You can also find looping behavior that makes visitors stuck to improve your site’s user experience–which is a top factor in SEO performance.
2. GA4 Cohort Exploration
The GA4 Cohort Exploration report shows how groups of users with shared common attributes interact with your site over time. It creates user groups based on shared conditions (a cohort), such as the same new customer acquisition date, transactions, and conversions.
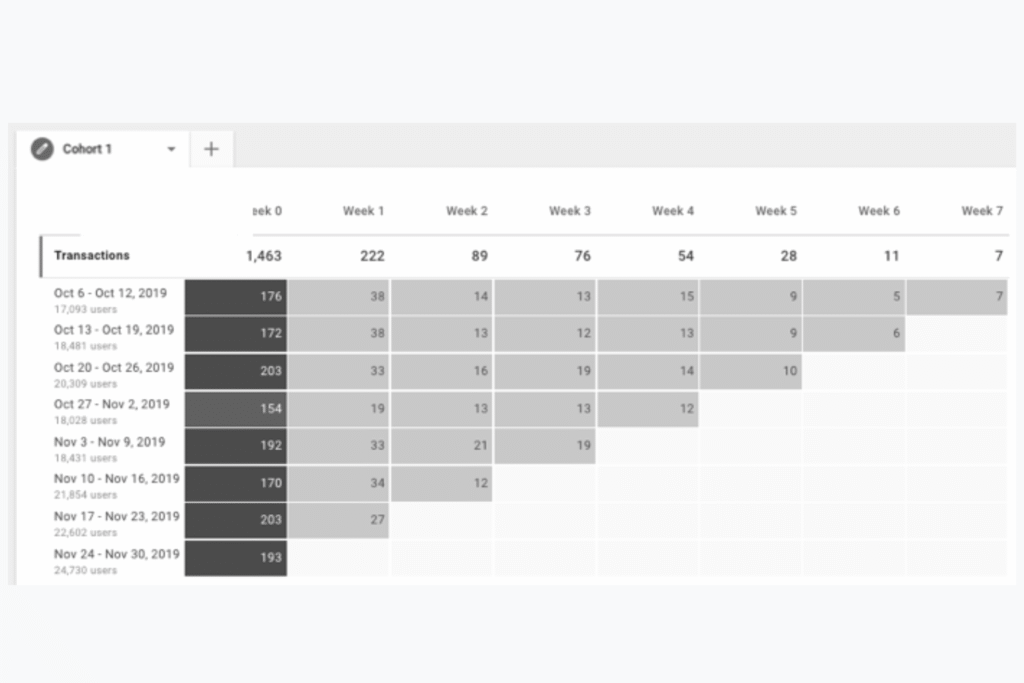
This dashboard measures visitor acquisition and retention by letting you create user cohorts that meet specific criteria.
For example, if you’re running a website promotion, you can see how long it takes newly acquired and returning customers to buy. These microtrends can help you optimize remarketing campaigns for your dynamic display ads by re-engaging with them at the right time.
3. GA4 Funnel Exploration
The GA4 Funnel Exploration report visually shows the steps users take to complete a task on your website and how successful they were at doing it. This dashboard measures how effectively your site supports conversions because you know where people typically drop off.
These usually involve how user-friendly your website is, so you can uncover areas of improvement to make it easier for them to complete their customer journeys.
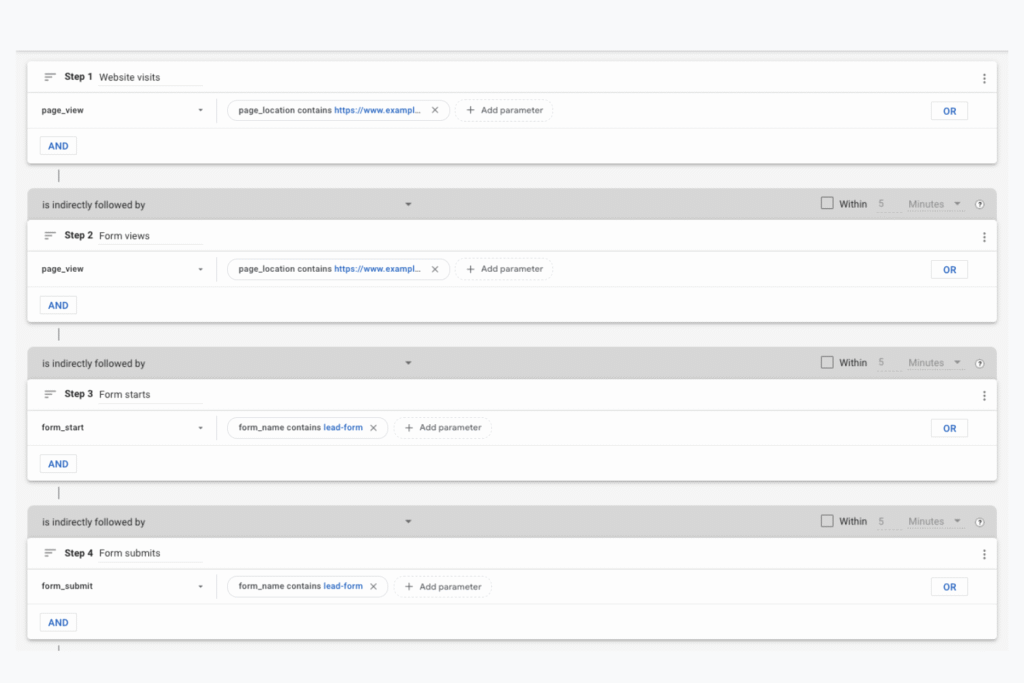
For example, this report shows the average elapsed time between each funnel step. If you find users taking a long time to move from cart to checkout, you may have functionality issues that make it hard for them to take the next step. User-friendliness is a top priority in Google’s search algorithms, ensuring they provide relevant content that is easy to navigate.
4. GA4 User Exploration
The GA4 User Exploration report dives deeper into your website’s user behavior based on the segments you create or import. These include individual activities, like how, when, and where the user was acquired, plus the timeline of events triggered by that user on your site by date.
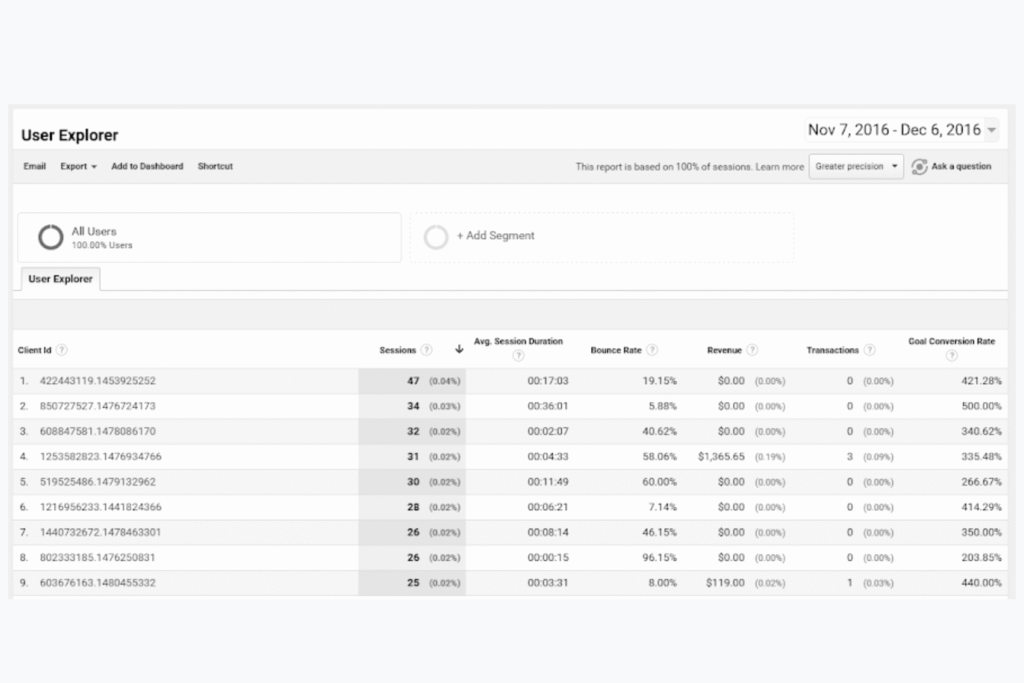
This dashboard is essential to better understand your visitors’ behavior so you can personalize your site’s experience for them or troubleshoot any issues. For example, if a customer had an issue placing an order on your site, you can analyze what went wrong based on the actions they took and create a segment of users who take similar ones going forward.
It’s about analyzing how your most valuable users engage with your site, the paths they follow, where they spend their time, and the promotions they click. That way, you can optimize your site’s user experience and SEO content for conversions when you know which ones they interact with the most.
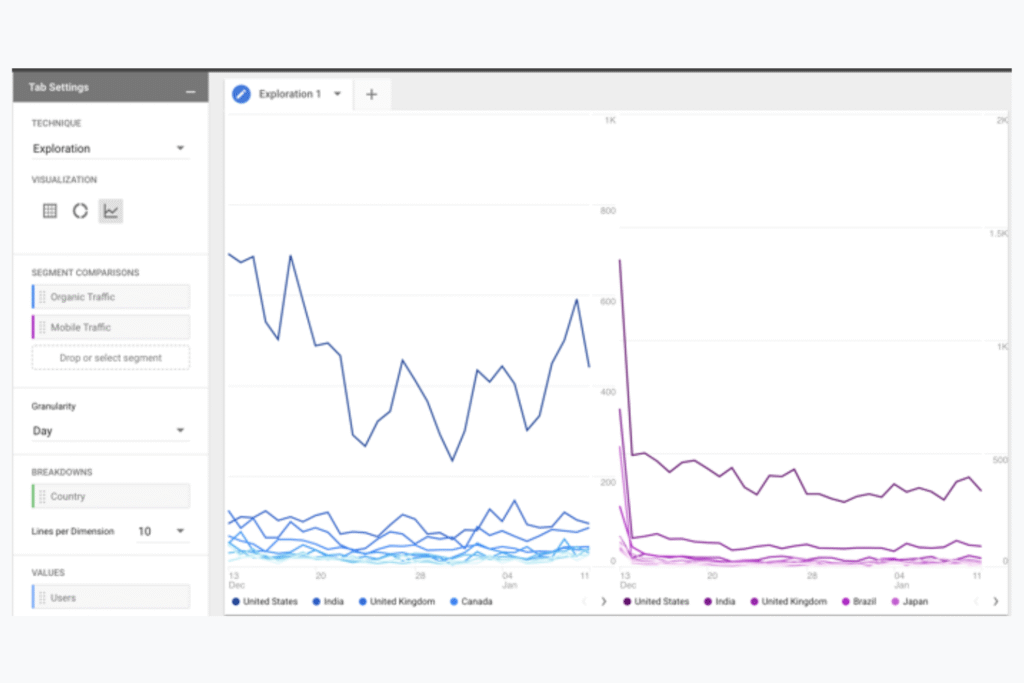
5. GA4 Free-Form Exploration
The GA4 Free-Form Exploration report shows your site’s SEO data visually with multiple style options, including:
- Crosstabs
- Bar charts
- Pie charts
- Line charts
- Geo maps
- Scatter plots
There’s also an anomaly detection that lets you identify outliers in your SEO data over time or within a segment at the same period. It’s a statistical feature using Analytics Intelligence to flag a single metric within a single dimension value or over several metrics and dimension values at a point in time. That way, you can forecast the value of specific SEO metrics in a time series.
From comparing several metrics side by side to creating audience segments from selected metrics, it’s highly flexible in customizing your SEO data with several visual styling features.
6. GA4 Segment Overlap
The GA4 Segment Overlap report shows up to three user segments and how they relate to each other. This dashboard helps refine SEO data by identifying new user segments who meet complex criteria and how they overlap.
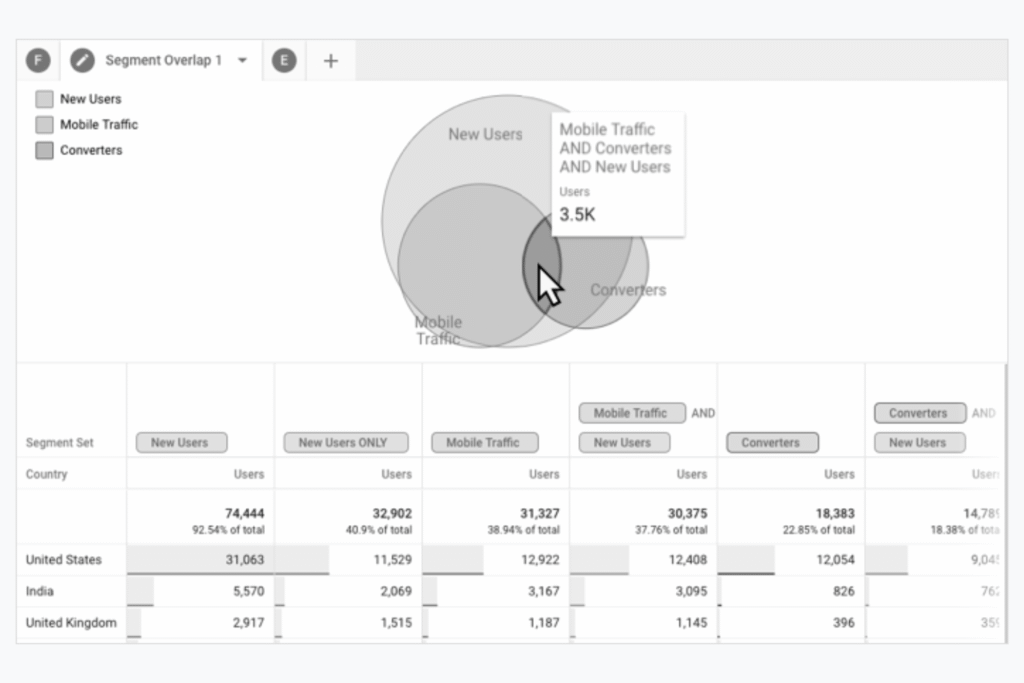
For example, you can create three user segments on New Users, Mobile Traffic, and Converters. Isolating these specific audiences helps you understand the connections between valuable user groups on your website for SEO optimization opportunities.
You may find that your new users have different characteristics on mobile and desktop, such as one device converting more than the other. This information can help you optimize the mobile design on the pages they’re visiting to increase conversions.
7. GA4 User Lifetime
The GA4 User Lifetime report examines user behavior and value over their lifetime as a customer. It shows the source, medium, and campaign that drove users with the highest value over a set period. This dashboard helps measure customer lifetime value to help improve your site’s retention strategies.
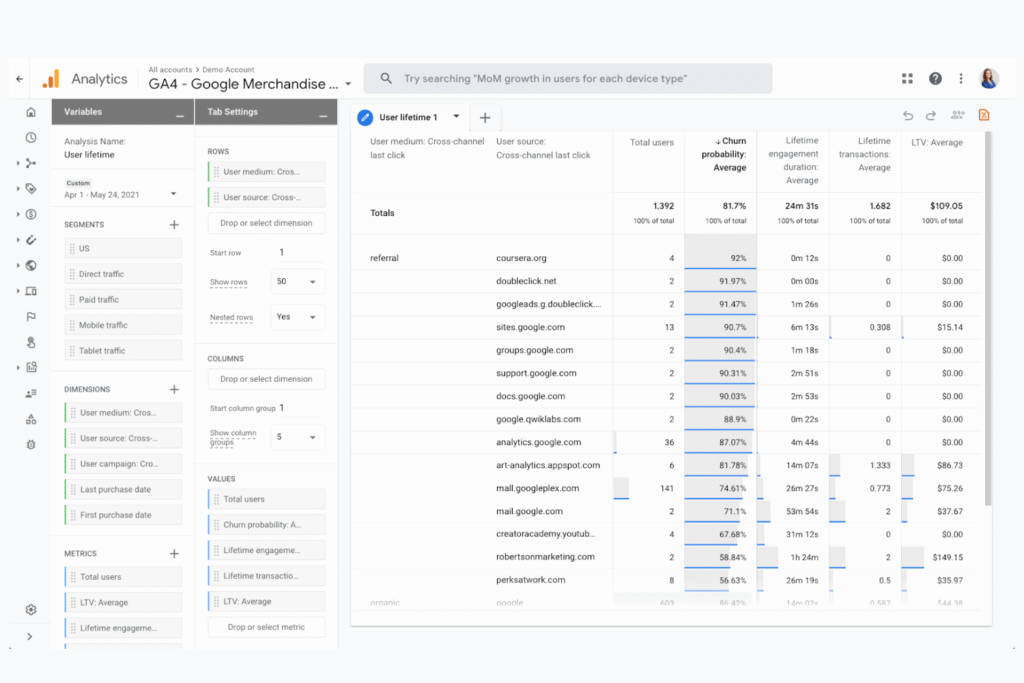
This report helps you understand which SEO campaigns are the most valuable to your existing customers and allocate your budget and resources more effectively. You’ll know the traffic source contributing the highest lifetime value of users, so you can optimize creatives and copy in your paid or organic search efforts based on these insights.
Your GA4 Metrics Show Valuable Insights: Leverage Them Fully to Maximize Your Site’s SEO Success
SEO alone is multifaceted, and navigating several GA4 reports with many available features can be challenging. Let us help you leverage the power of these tools with our SEO exports.
At Reach Marketing Pro, we’re a full-service digital agency with extensive experience in all aspects of SEO marketing, including website optimization, copywriting, and GA4 reports. We’ll also provide quarterly SEO reporting across Google’s platforms with key metrics that matter most to your bottom line to ensure your strategies remain relevant.
Ready to strengthen your site’s SEO performance?
Learn more about our SEO services or contact us to get started today!